Data analysis pipelines, end to end

From in vitro display libraries to in vivo immune repertoires — process raw NGS into a ranked set of developable candidates, all in one platform.

In vitro antibody discovery

In vitro antibody discovery

From raw NGS to ranked candidates. Find enriched clones without liabilities.

Enrichment analysis scatter plot — clones tracked across panning rounds.
  • screening throughput
  • 60%less time on manual steps
  • Lower riskof late-stage failures

Challenges of in vitro antibody discovery

Panning complexity outpaces the tools

Multi-round, multi-condition campaigns generate datasets that need flexible, user-defined comparisons. Static tools force you to flatten that complexity or work around it manually.

Enrichment doesn't equal affinity

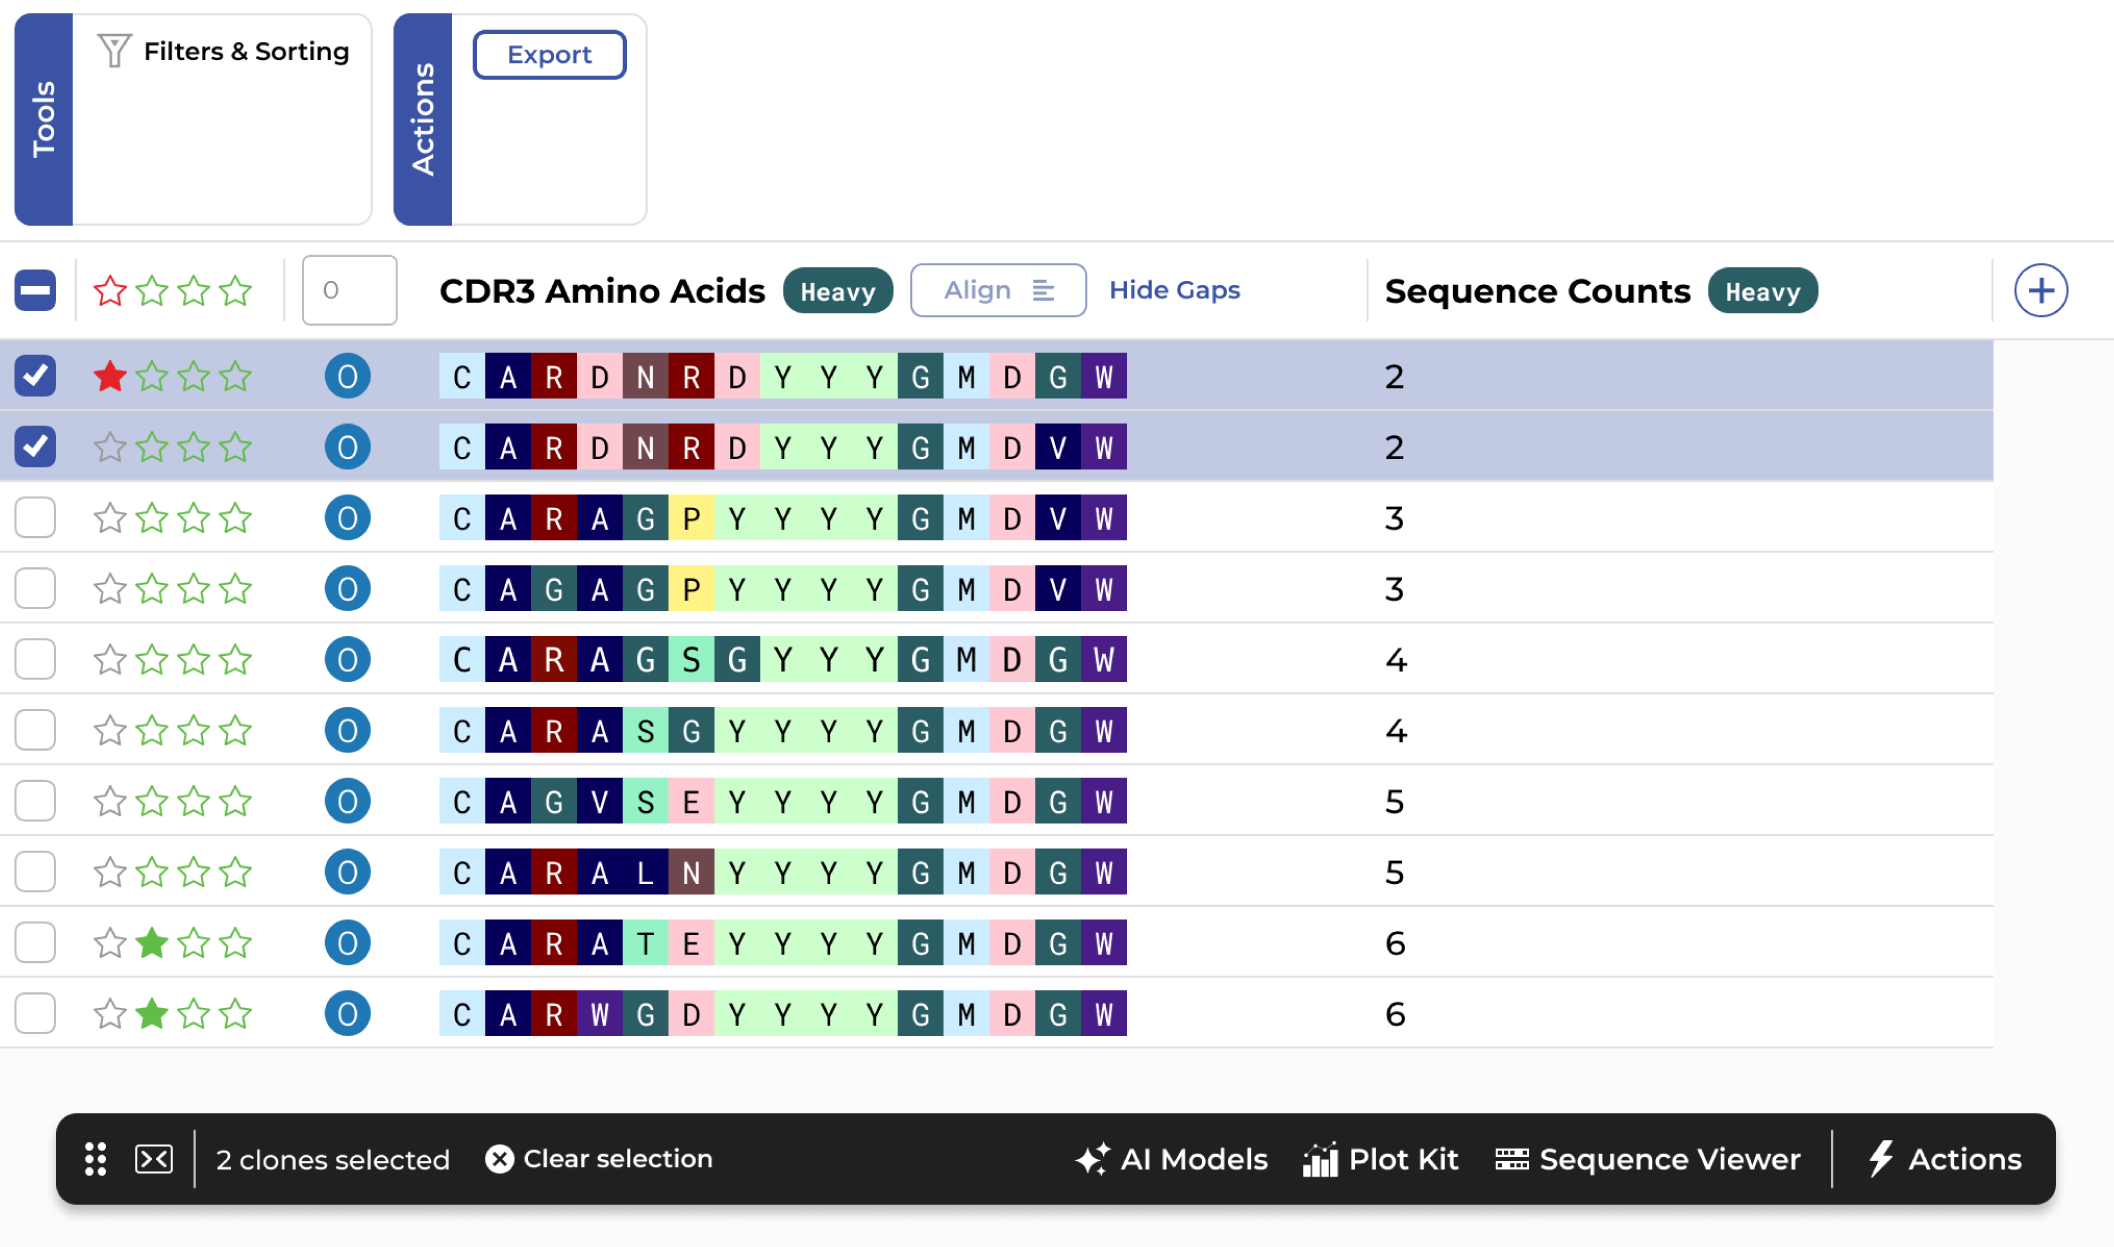
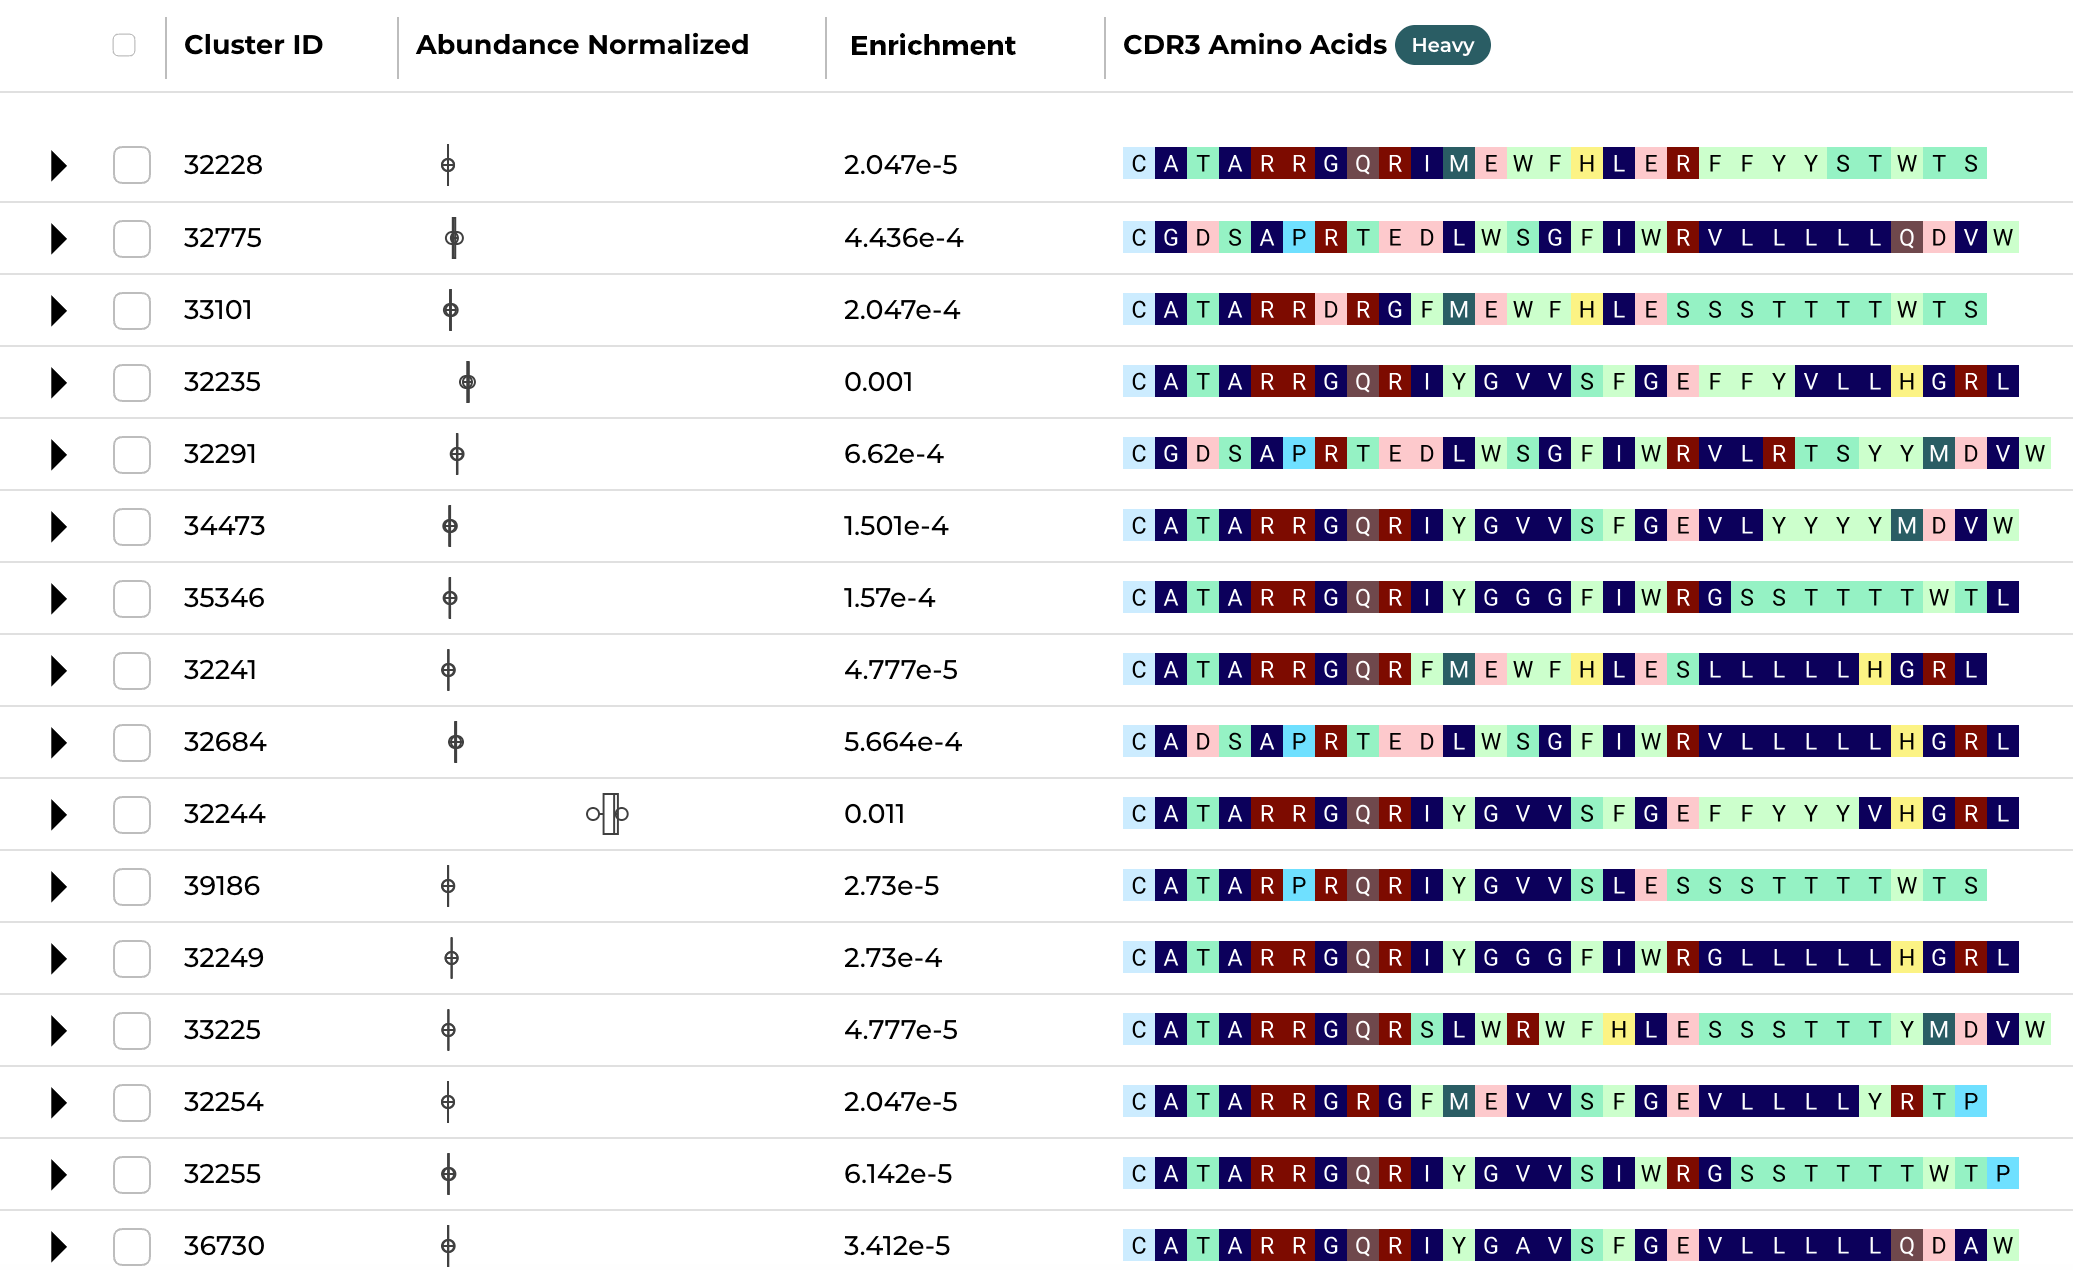
High-frequency clones are fast growers, not necessarily strong binders. Without the right enrichment analysis, the best candidates stay buried in your data.

Liabilities found late cost the most

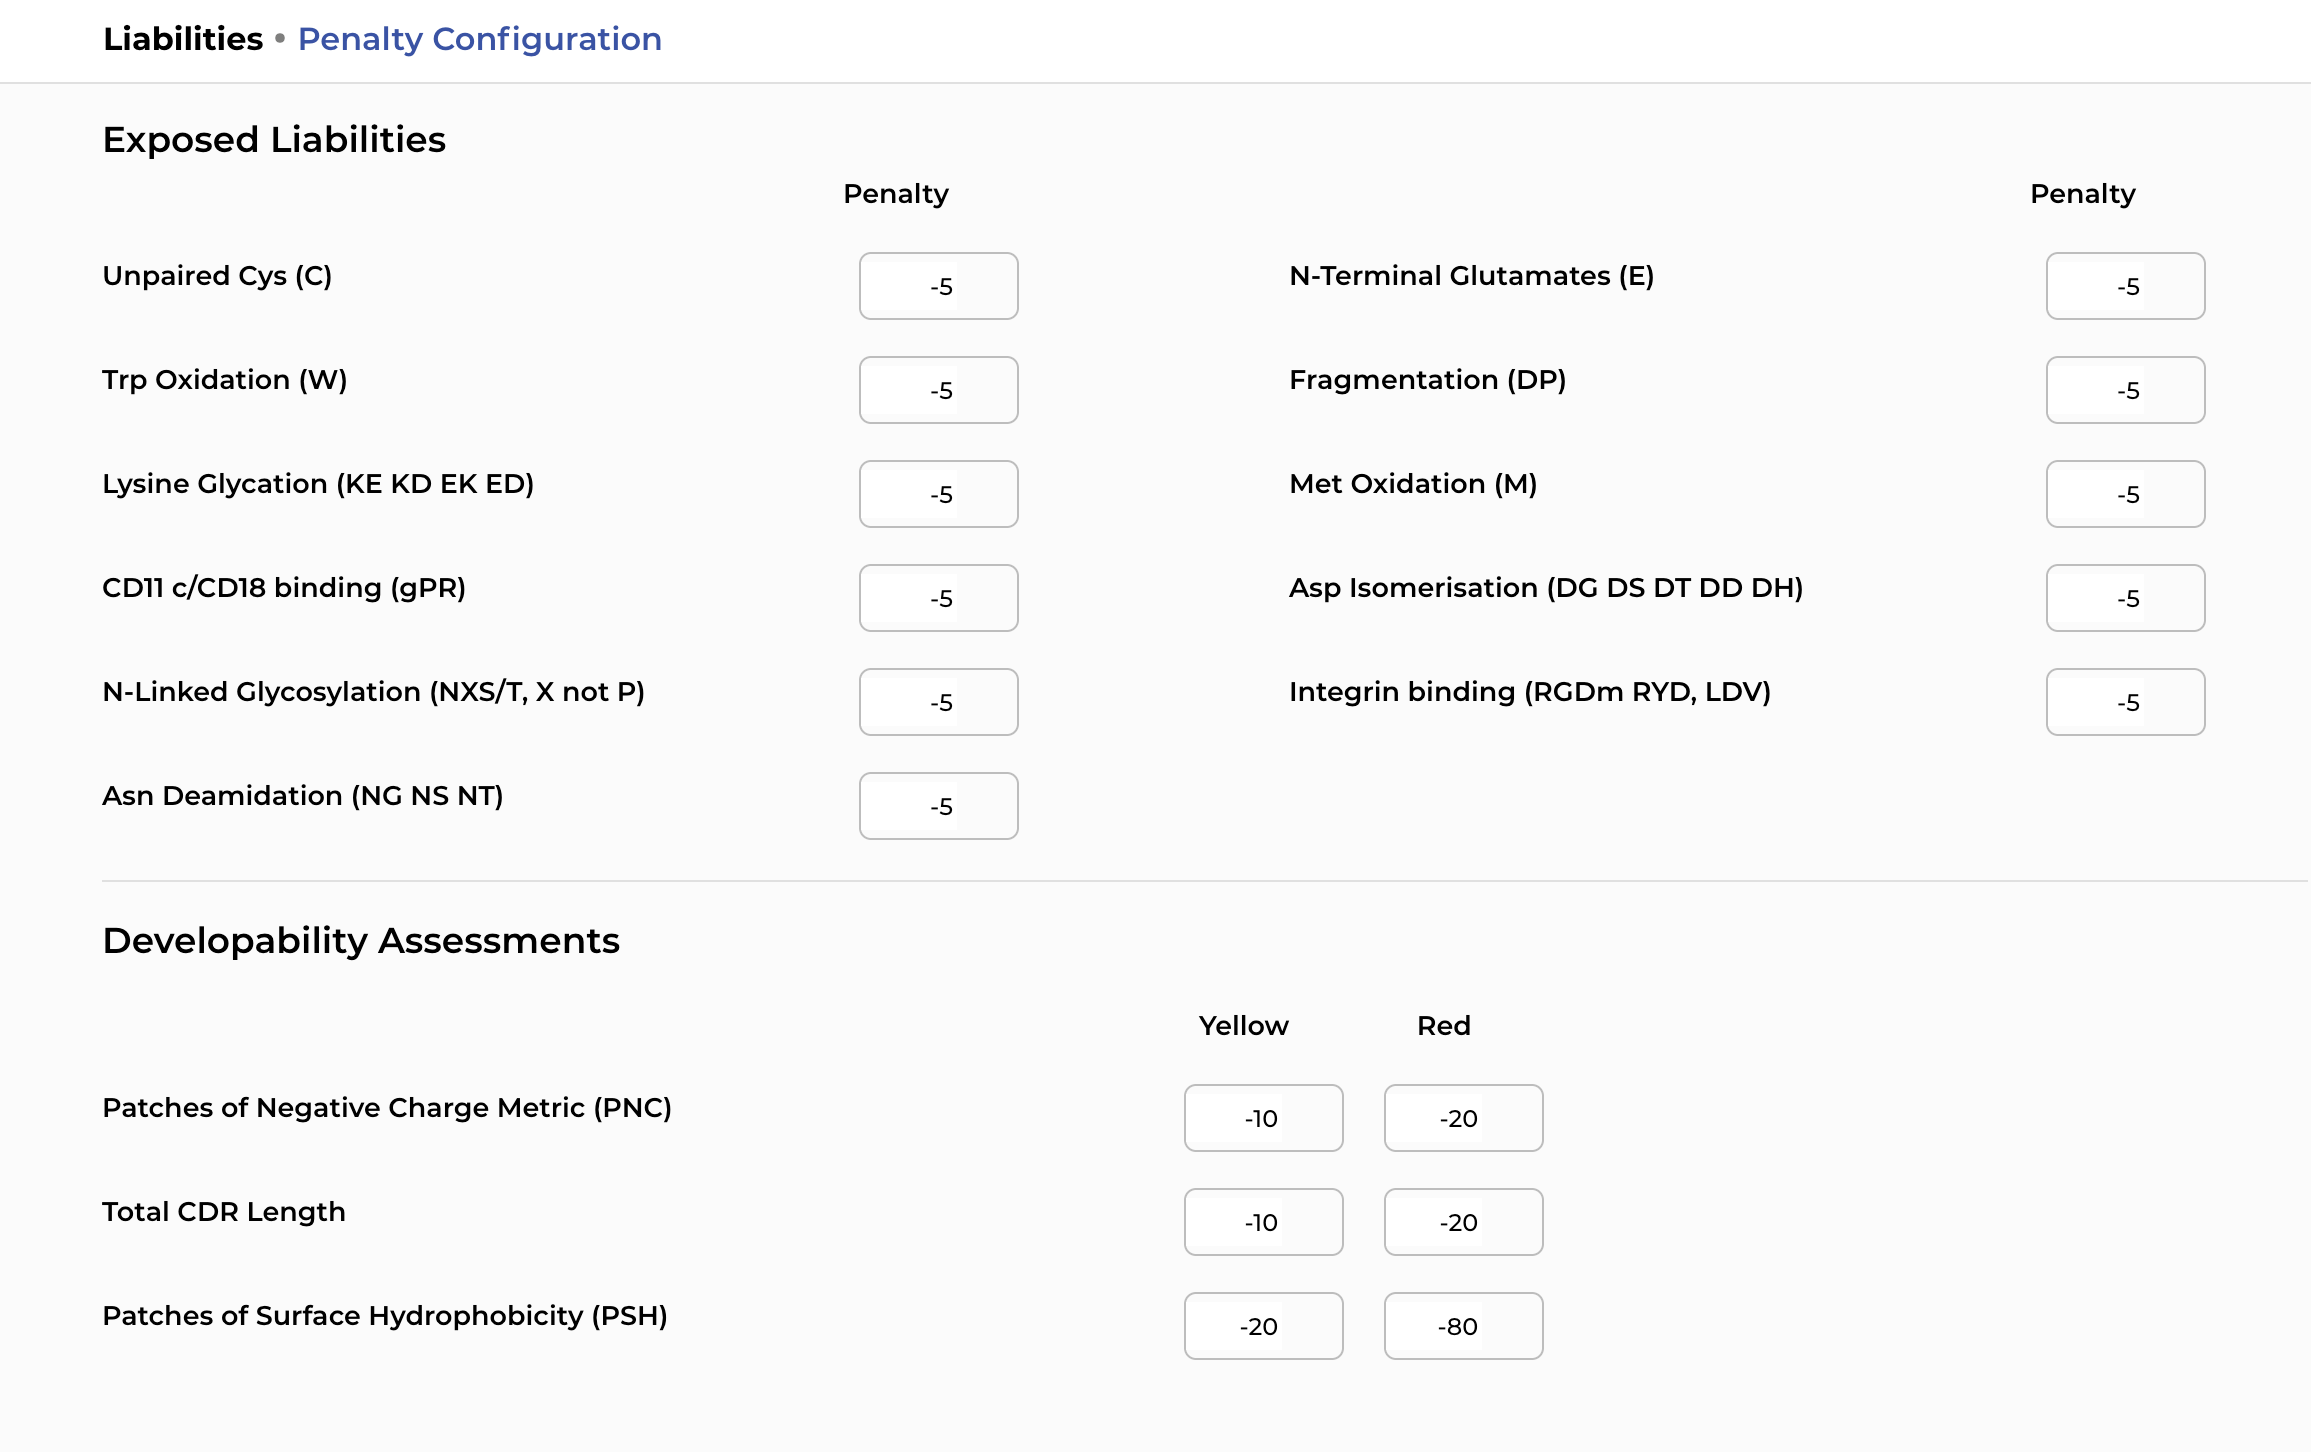
Sequence liabilities that slip through early selection cause failures deep in development. Catching them at the clone selection stage is where it matters.

Too many parameters for static tools

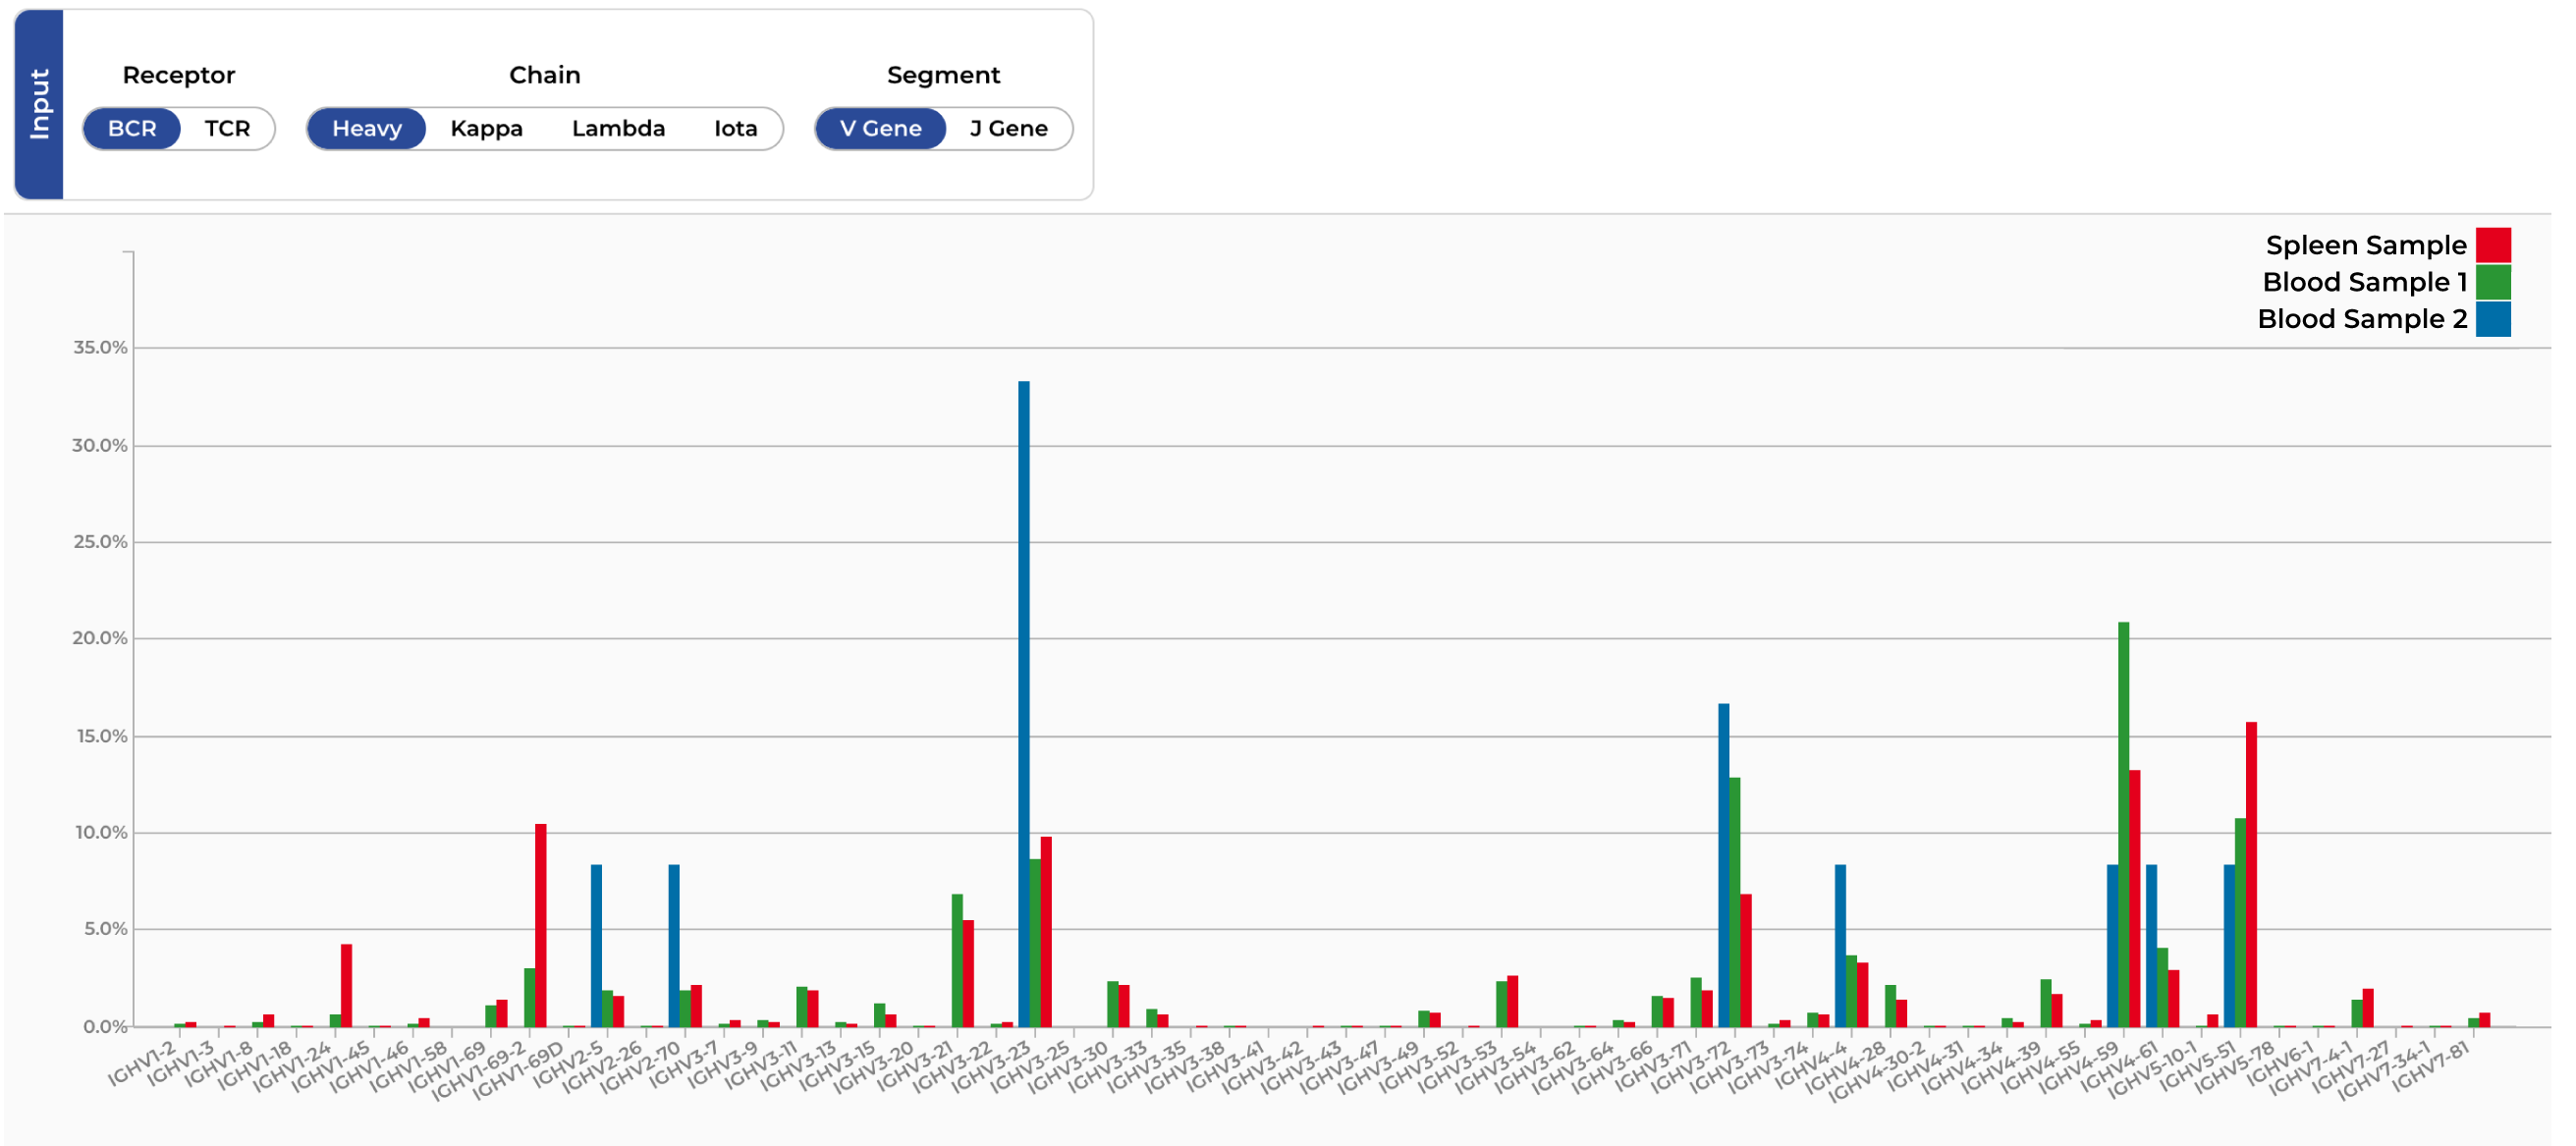
Antigen concentration, blocking conditions, round number, assay results — panning campaigns generate rich metadata. Cross-comparing all of it in a spreadsheet isn't just slow, it's practically impossible.

Simply select better antibodies

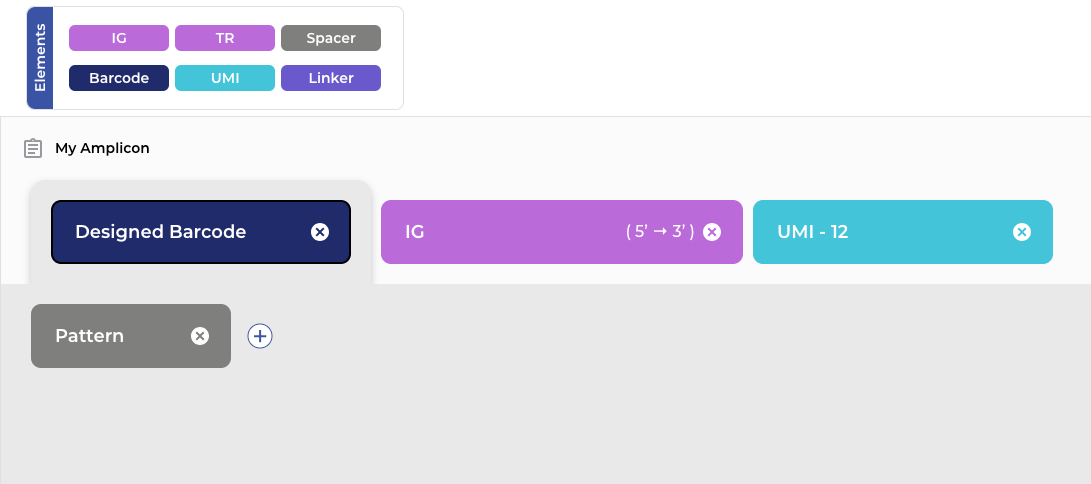
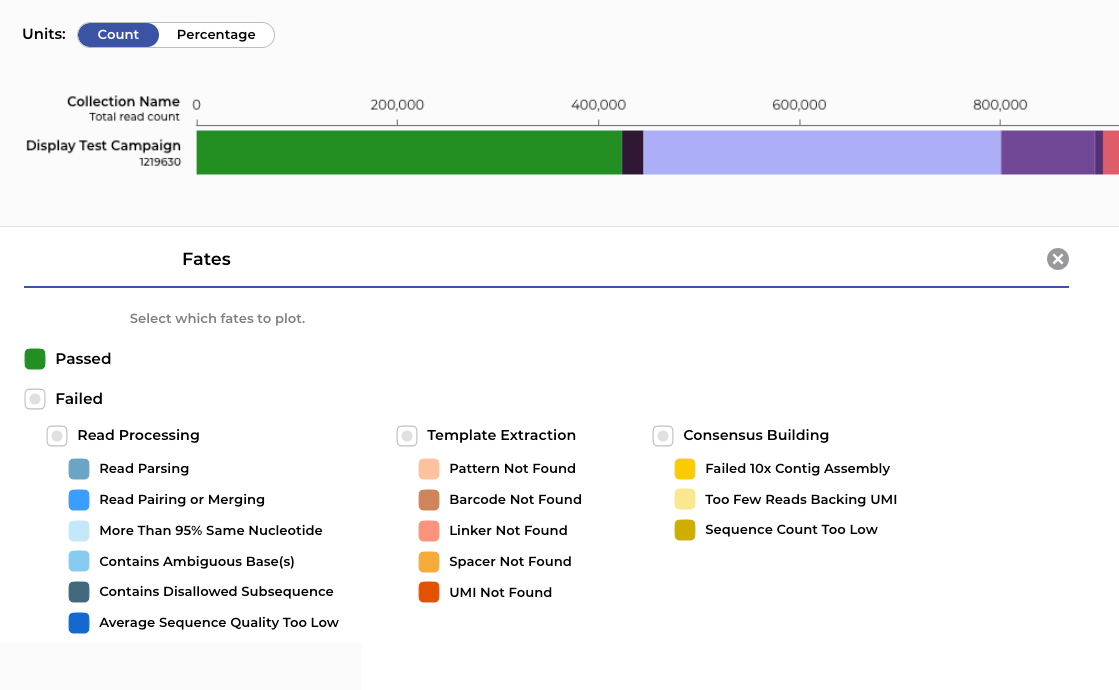
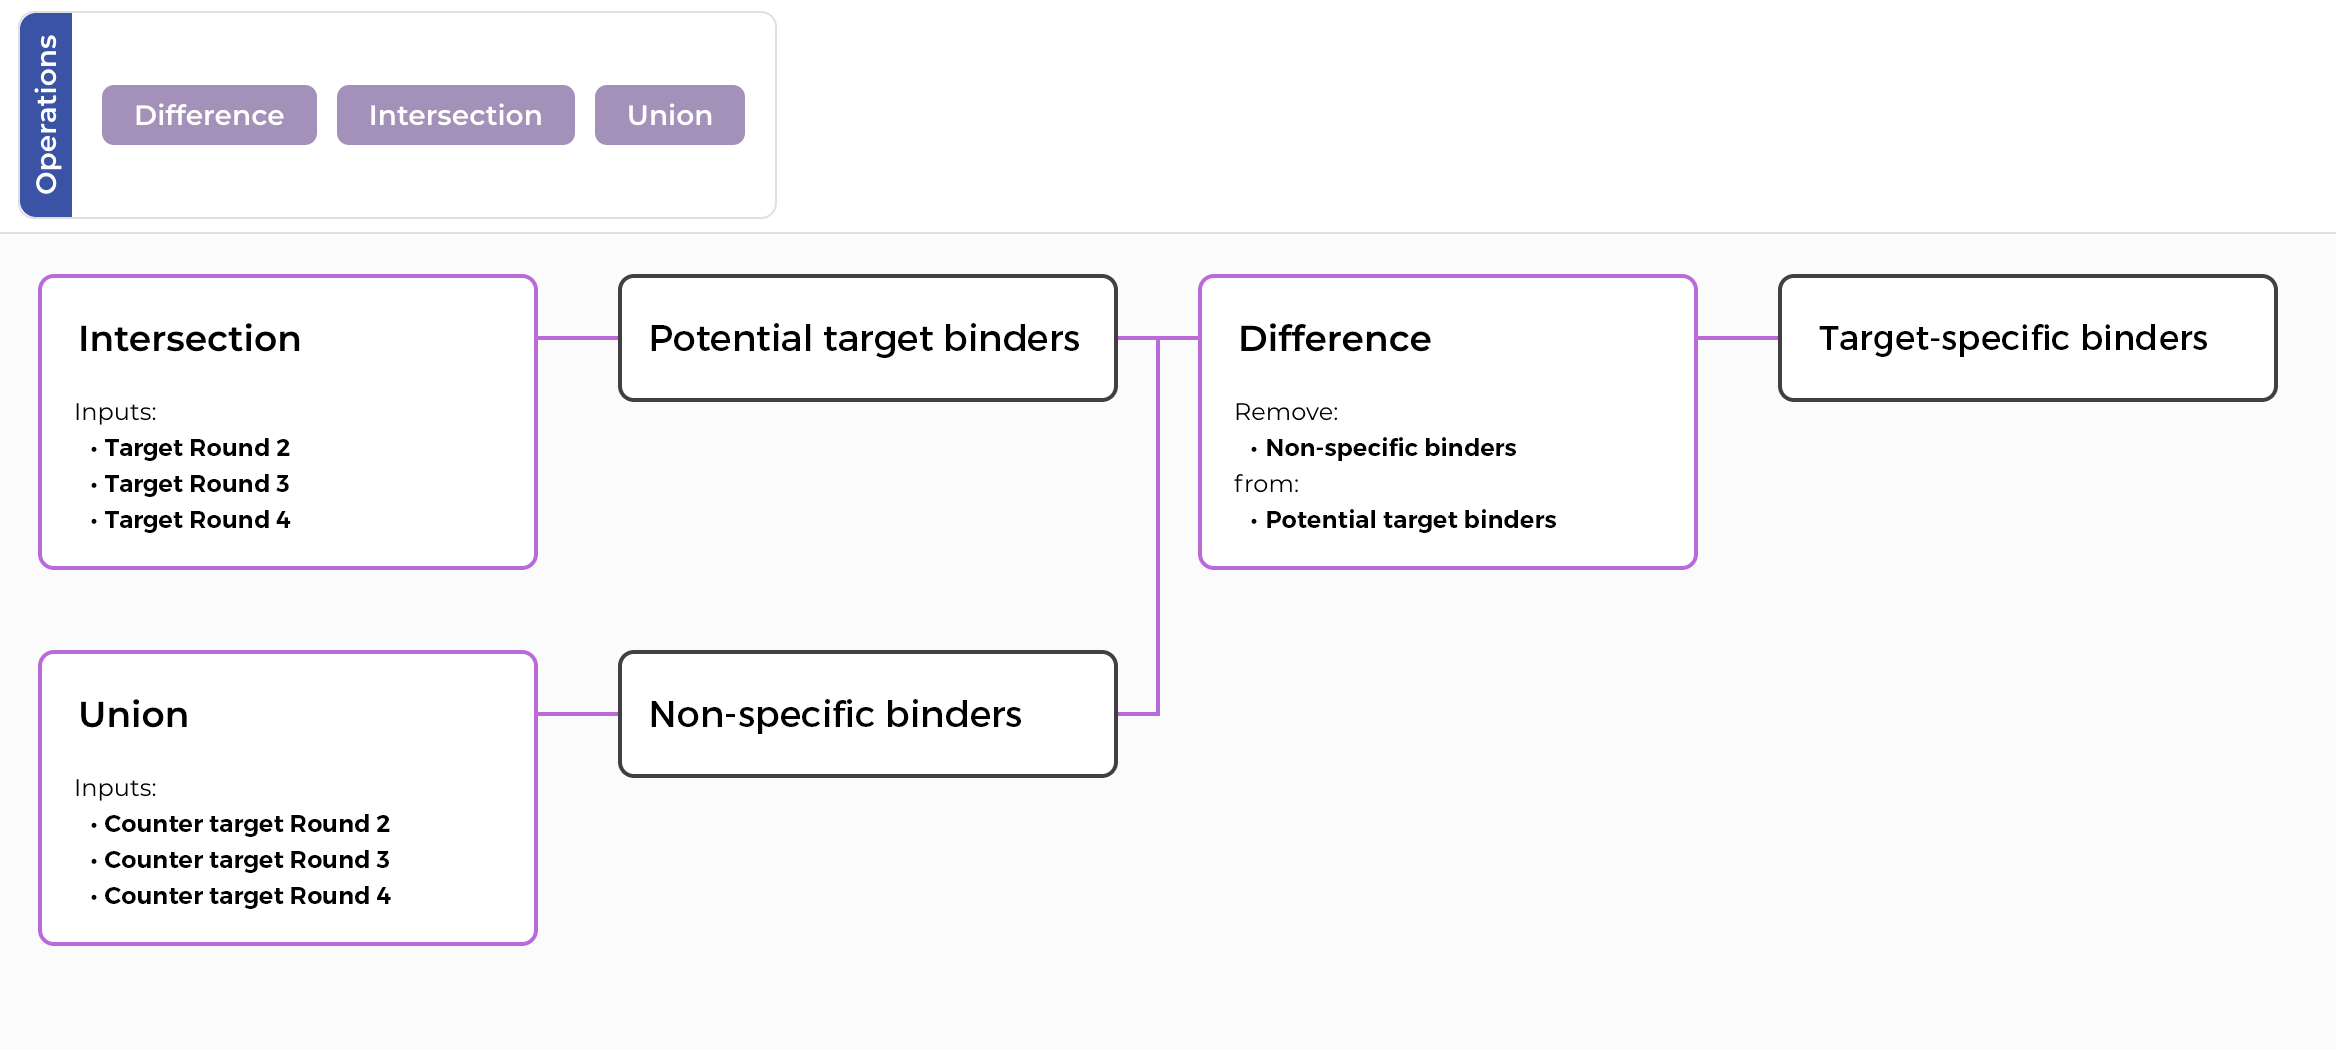
Build your panning campaign in a flexible analysis environment — multiple rounds, targets, and counter-selections, no matter how complex the design. Overlay enrichment scores, assay results, and liability predictions in interactive visualizations, and make decisions on promising candidates from a single screen.

End-to-end in vitro clone selection

Clone annotation

  • Specify and analyze any amplicon configuration with UMIs, barcodes, or linkers.
  • Annotate CDRs, frameworks, barcodes, and UMIs across any amplicon configuration.
  • Process millions of sequences within an hour.
Amplicon builder annotating clones — CDRs, frameworks, barcodes, and UMIs.

Quality control

  • Interactive visualizations for FASTQ quality control, including Read Length Distribution and Base/Sample Quality.
  • Inspect read fate and detect sequencing biases.
Quality-control visualization for FASTQ data.

Clonotype clustering

  • Group clones by any combination of regions & genes: CDRs, framework regions, VDJ genes, single or paired chains.
  • Sort and filter clusters by any metadata, like gene usage, somatic hypermutation levels, and CDR3 length.
Clonotype cluster overview.

Enrichment analysis

  • Track clones across panning rounds to identify highly enriched candidates through interactive, user-defined visualizations.
  • Freely join, intersect, and subtract your datasets to match your panning campaign design.
  • Overlay any metadata — assay results, liability scores, antigen conditions — directly onto enrichment plots.
  • Include negative controls to track antigen-specific clones, and subtract irrelevant antibodies found in control conditions.
Enrichment canvas — joining, intersecting, and subtracting datasets across panning rounds.

Developability analysis

  • Run ML-based liability predictions or upload your own, and overlay them onto your enrichment data.
  • Compare candidates against molecules that have reached clinical development.
Liability configuration with ML-based developability predictions.

Candidate prioritization

  • Make informed decisions by visualizing all your data in one view: in-silico predictions, experimental results, and enrichment scores.
  • Access Heavy & Light chain information at any stage.
  • Set flexible thresholds to make clone selection faster, consistent, and reproducible.
Enrichment results brought together for candidate prioritization.

In vivo antibody discovery

In vivo antibody discovery

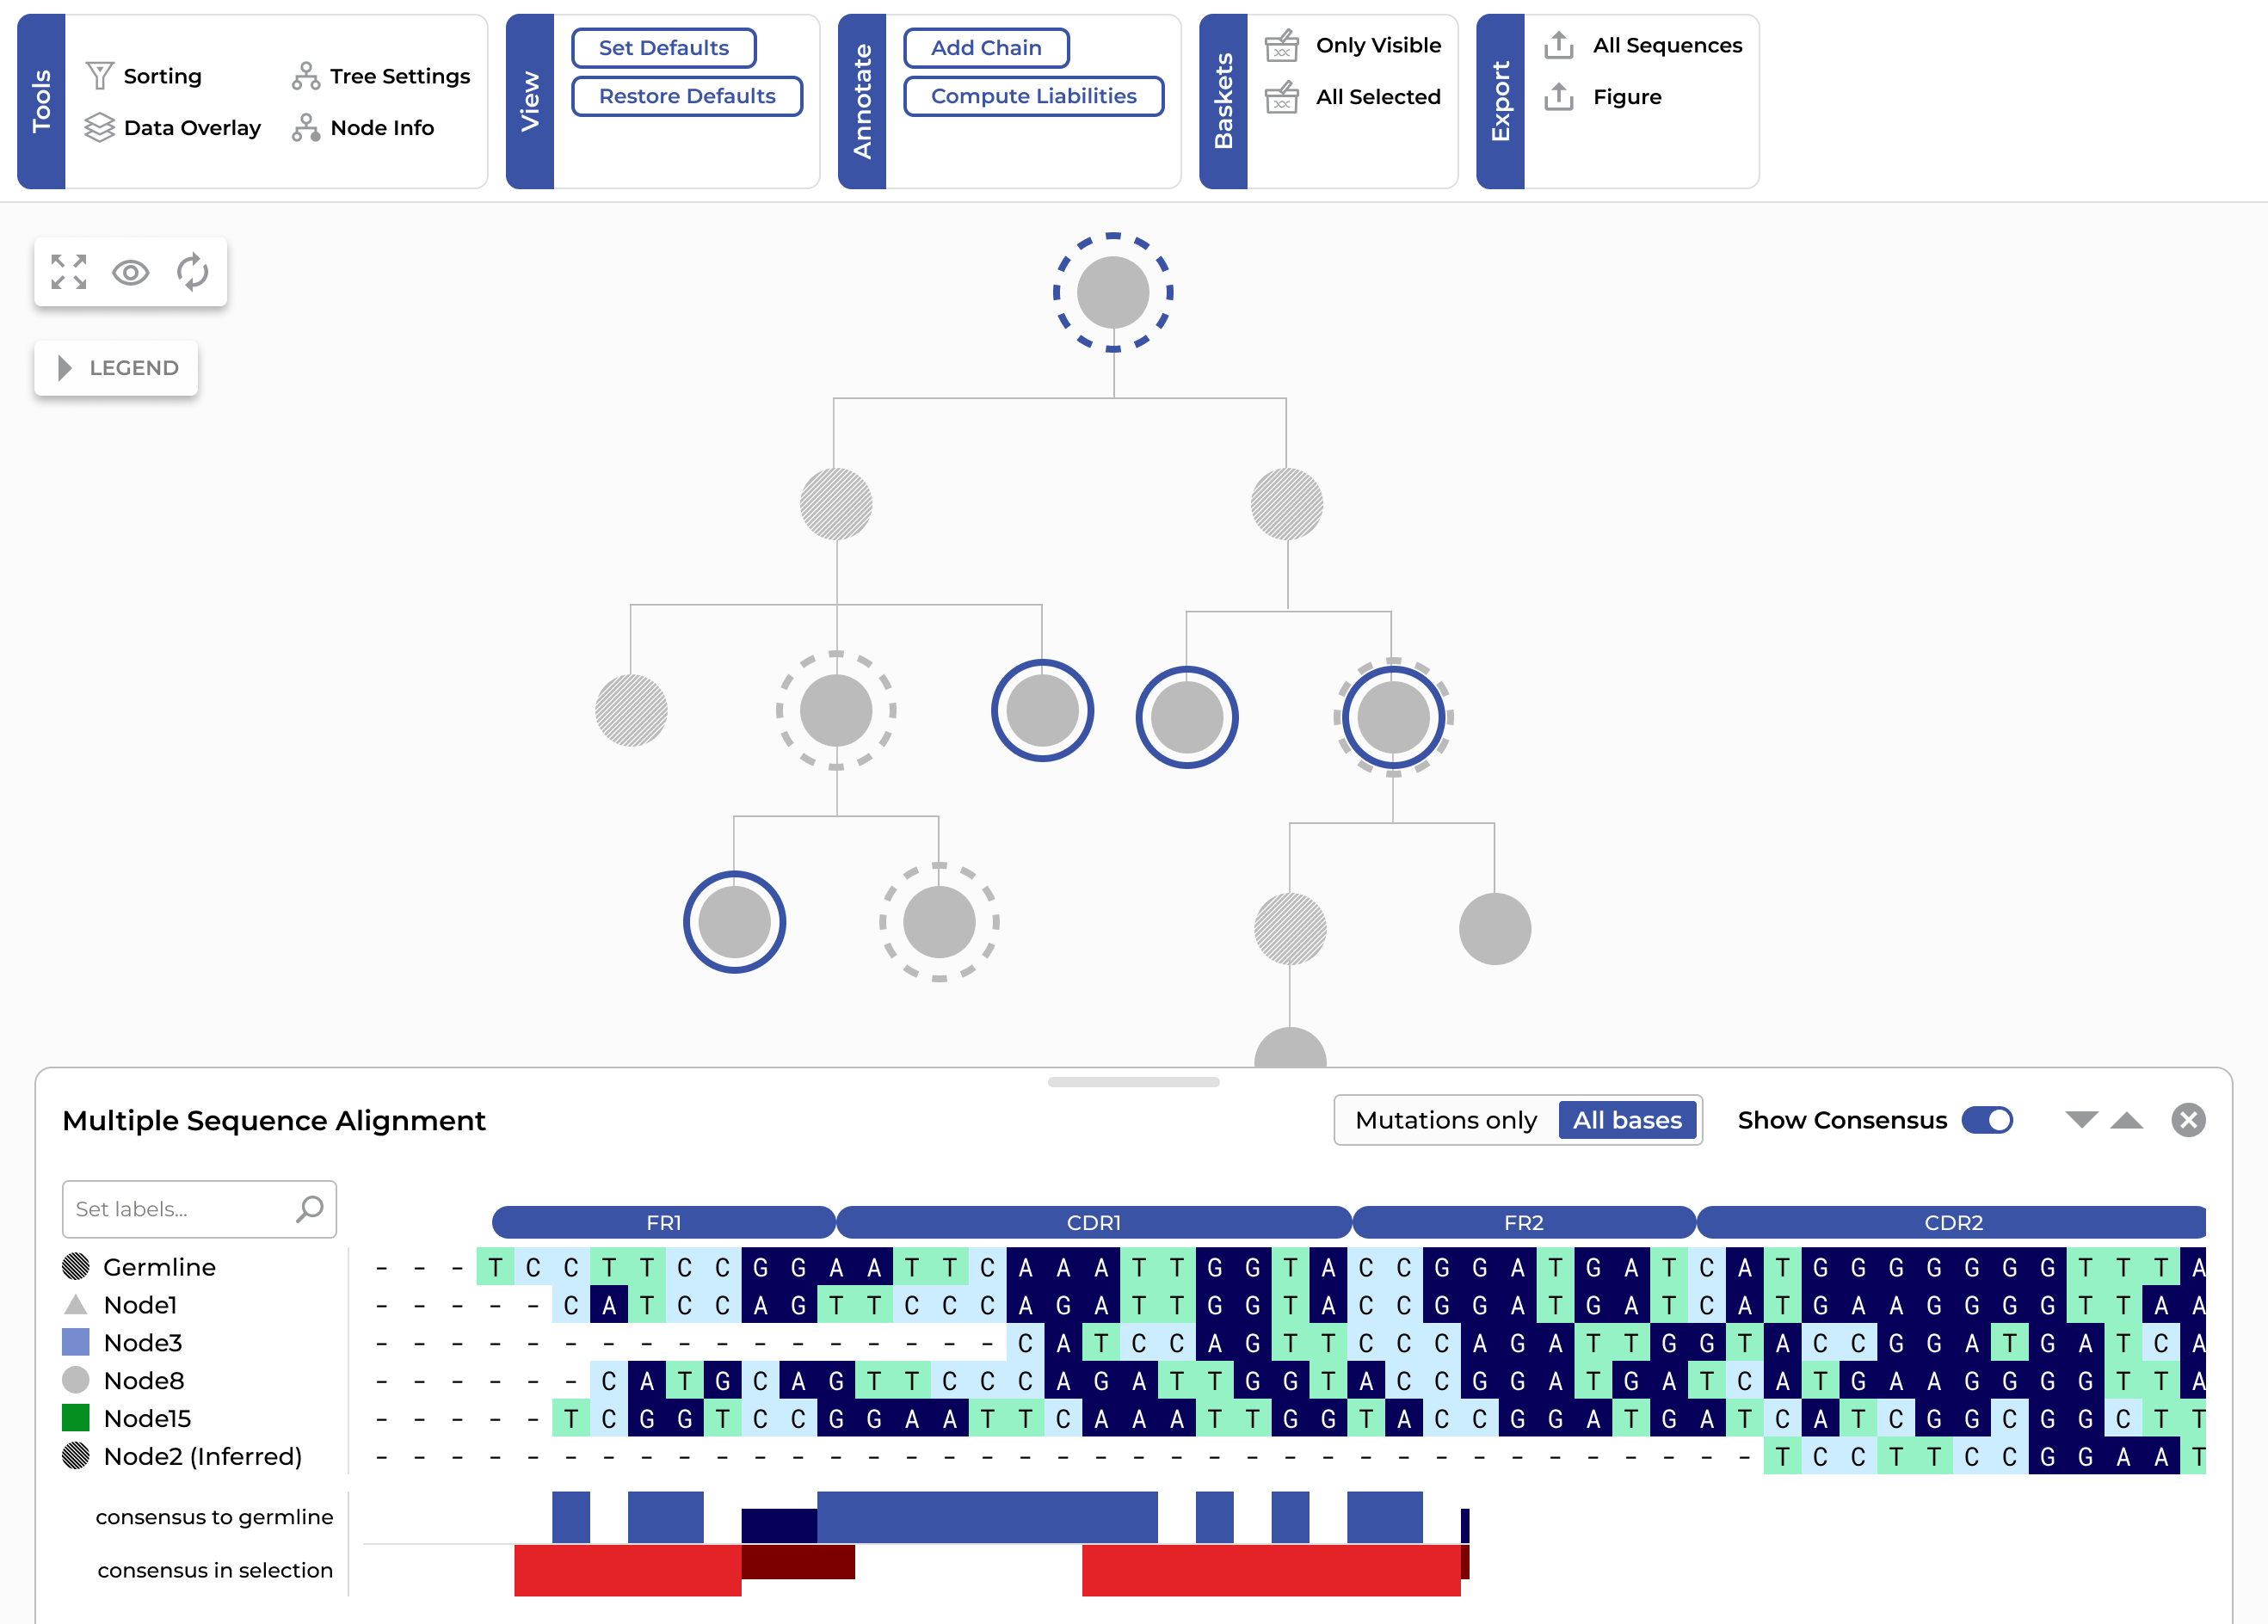
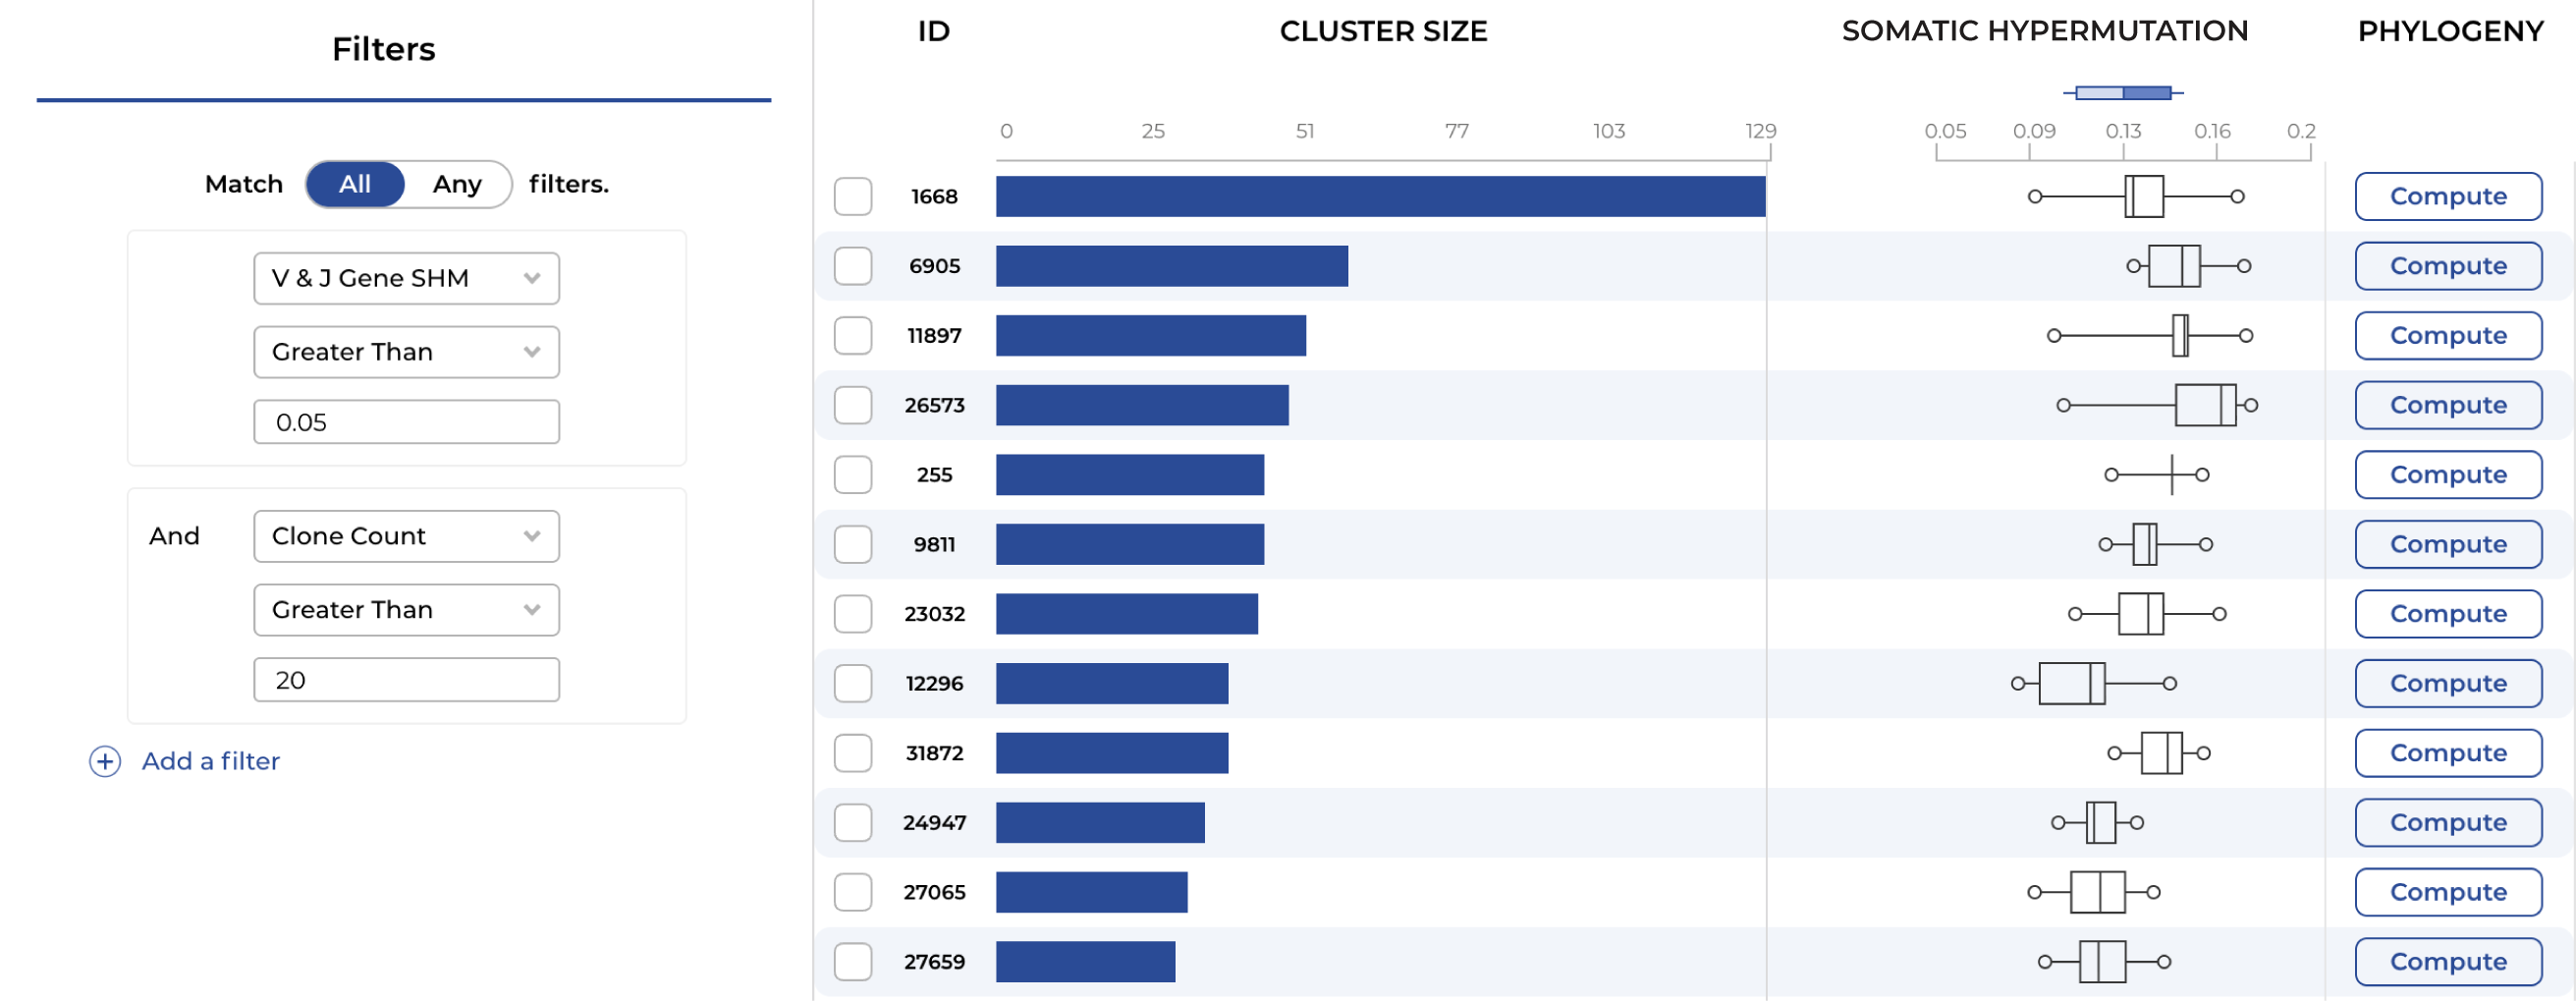
Explore lineages and track somatic hypermutation through interactive phylogenetic trees. Integrate bulk and single-cell data, overlay assay results, and select a diverse set of developable leads.

ENPICOM Platform phylogeny view — interactive phylogenetic trees tracing affinity maturation across lineages.
  • faster lead clone selection
  • 50%faster timelines with automation
  • Lower riskof late-stage failures

Challenges of in vivo antibody discovery

Lineage complexity hides your best candidates

Tracing affinity maturation across animals and timepoints is hard. Without clear lineage tracking, picking the right branch is guesswork.

Immunization generates enormous diversity

Thousands of clones across multiple animals, timepoints, and immunization conditions. Finding the signal in that noise is hard.

Liabilities found late cost the most

Sequence liabilities caught late are expensive. Overlay liability predictions during clone selection to cut that risk early.

Frequency doesn't equal quality

Dominant clones in a repertoire aren't necessarily the best binders or the most developable.

Diversity is hard to guarantee

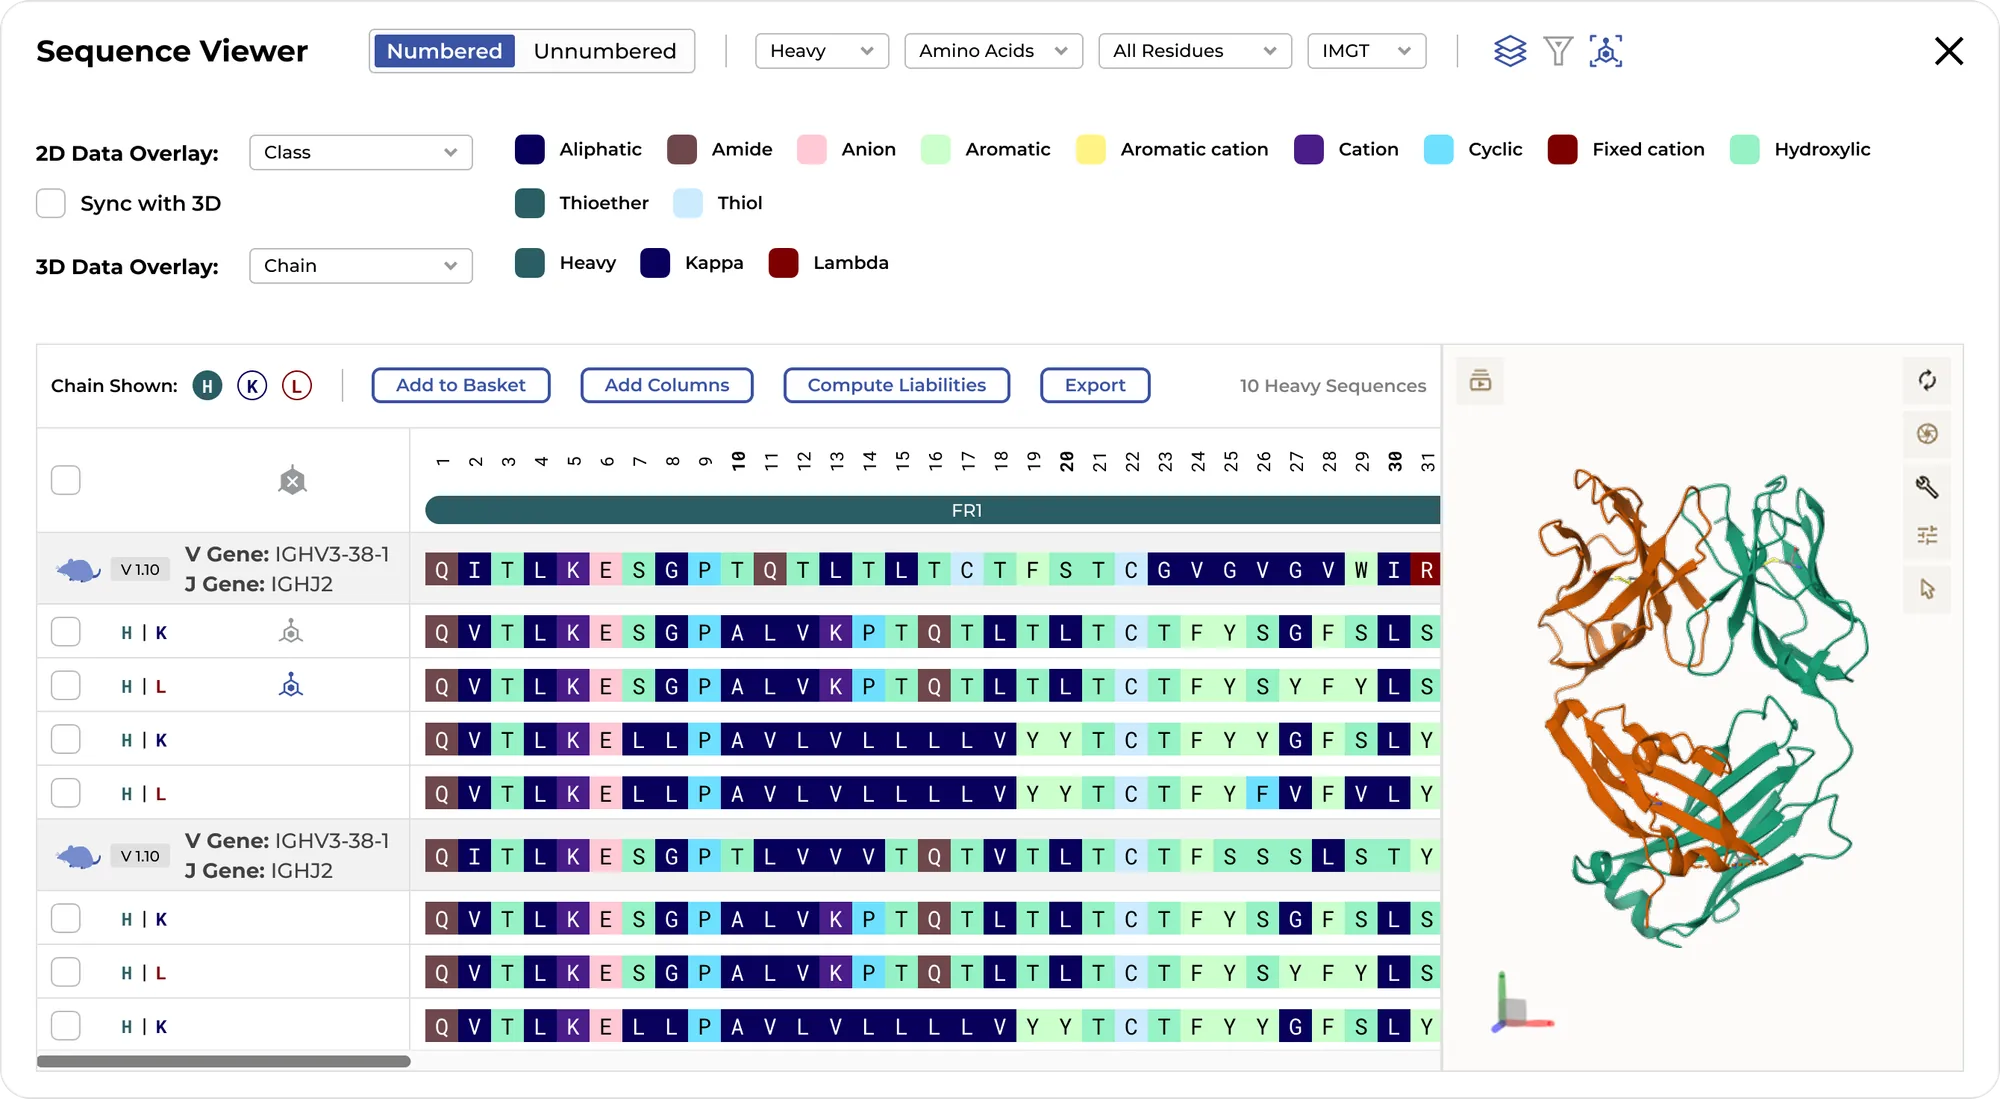
Selecting candidates that are truly structurally diverse requires more than just picking top clones by abundance or affinity.

Metadata fragmentation

Assay data, animal metadata, and immunization conditions all live separately from the sequence data, making informed decisions hard.

Simply select better antibodies

With the ENPICOM Platform, you can integrate any assay data from wet-lab experiments and compute structure-based developability profiles in silico. This information is seamlessly incorporated into your analysis workflow, creating information-rich visualizations in clustering, phylogeny, and the final selection of the optimal mix of diverse and developable hits.

End-to-end in vivo clone selection

Clone annotation

  • Specify and analyze any amplicon configuration with UMIs, barcodes, or linkers.
  • Annotate CDRs, frameworks, barcodes, and UMIs across any amplicon configuration.
  • Process millions of sequences within an hour.
Amplicon builder annotating clones — CDRs, frameworks, barcodes, and UMIs.

Quality control

  • Interactive visualizations for FASTQ quality control, including Read Length Distribution and Base/Sample Quality.
  • Inspect read fate and detect sequencing biases.
Quality-control visualization for FASTQ data.

Repertoire overview

  • Visualize V/J gene usage, diversity measures, and CDR3 length distribution.
  • Stratify data by any metadata, with toggles, sliders, and tooltips for intuitive control.
V/J gene usage and repertoire overview plots.

Clonotype clustering

  • Group clones by any combination of regions & genes: CDRs, framework regions, VDJ genes, single or paired chains.
  • Sort and filter clusters by any metadata, like gene usage, somatic hypermutation levels, and CDR3 length.
Clonotype cluster overview.

Phylogeny

  • Explore phylogenetic trees for clusters of interest and trace affinity maturation across lineages.
  • Overlay any metadata — assay results, SHM levels, liability predictions — onto interactive tree visualizations to identify the best candidates.
Interactive phylogenetic tree with metadata overlays.

Developability analysis

  • Run ML-based liability predictions or upload your own, and overlay them onto your phylogenetic trees.
  • Benchmark candidates against antibodies that have reached clinical development.
Sequence viewer with developability and liability annotations.

Candidate prioritization

  • Visualize all your data in one view: in-silico predictions, experimental results, and SHM levels.
  • Access heavy & light chain information at any stage.
  • Set flexible thresholds to make clone selection faster, consistent, and reproducible.
  • Select a structurally diverse panel, not just the most abundant clones.
Candidate baskets for prioritizing leads.

Ready to accelerate your data analysis pipelines?

End-to-end in vitro clone selection workflow.
Enrichment analysis dot plot.
Large-scale comparative analysis.